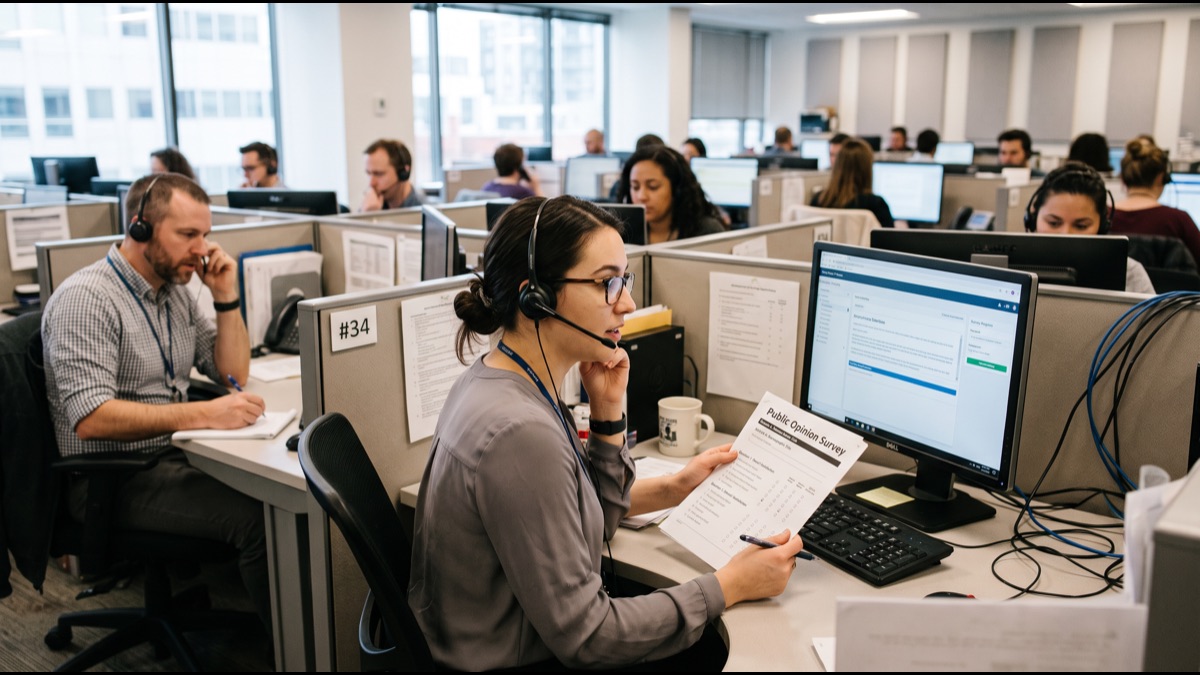
A poll claiming that a sample of one thousand people accurately reflects the views of tens of millions sounds, on its face, like a fairly implausible claim. Yet public opinion polling has been doing exactly this for roughly a century, and when done well its results routinely land within a few percentage points of the true population figure, a track record built on genuinely rigorous statistical machinery rather than guesswork.
Understanding how that machinery actually works, from sample selection through weighting and margin of error, explains both why polling is far more reliable than casual scepticism assumes and why specific elections still occasionally produce results that catch pollsters visibly off guard.
Why a Small Sample Can Represent Millions of People
The statistical logic underpinning polling rests on a genuinely counterintuitive result: once a sample is large enough and, critically, selected so that every member of the population has a known and roughly equal chance of inclusion, the accuracy of an estimate depends far more on that selection method than on the sample's size relative to the total population.
This is why a properly designed sample of around one thousand people can estimate opinion in a country of eighty million with almost the same statistical precision as it would in a country of eight million, a fact that consistently surprises people encountering polling methodology for the first time.
The genuine difficulty in polling has never really been the mathematics of sampling itself, which is well-established and reliable, but rather the practical challenge of actually achieving that idealised random selection in a world where not everyone can be reached or agrees to respond.
How Pollsters Actually Select Who to Ask
Traditional telephone polling relied on random digit dialling, generating phone numbers at random within a country's numbering system so that every household with a phone had a roughly equal chance of being called, an approach that worked well while landline penetration remained near universal.
As mobile phones and caller-screening became widespread, pollsters shifted toward dual-frame designs sampling both landlines and mobiles, and increasingly toward carefully constructed online panels, address-based sampling, or a mix of methods designed to approximate the same universal-coverage principle telephone sampling once achieved more easily.
Whatever the specific method, the underlying goal remains constant: reach a sample that plausibly represents the full population being studied, rather than simply the subset of people easiest or cheapest to contact through any single channel.
What Margin of Error Actually Means
A poll reporting a result with a margin of error of plus or minus three percentage points is not claiming certainty about the exact figure, but rather that if the same sampling process were repeated many times, the true population value would fall within that range in roughly ninety-five out of a hundred such samples.
Margin of error shrinks as sample size grows, but only slowly, following the mathematics of the square root of the sample size, which is why doubling a poll's cost by doubling its sample size only modestly tightens the margin of error rather than doubling precision outright.
A frequently overlooked point is that the published margin of error covers only random sampling variation; it says nothing about additional error introduced by non-response, weighting choices, or a genuinely biased sample, all of which can matter considerably more than the number itself suggests.
How Question Wording Changes Poll Results
Identical underlying opinions can produce meaningfully different poll results depending purely on how a question is phrased, since subtle changes in wording, question order, and the specific response options offered can all measurably shift how respondents answer.
Reputable pollsters test question wording carefully and often publish their exact question text alongside results specifically so that readers can judge whether the wording itself might have shaped the answer, a transparency practice considered a hallmark of methodologically serious polling.
This sensitivity to wording is also the primary mechanism behind so-called push polls, discussed later, where a question is deliberately worded to produce a predetermined impression rather than to genuinely measure opinion.
Why Response Rates Have Collapsed in Recent Decades
Response rates to telephone surveys have fallen dramatically over the past several decades, from roughly a third of people contacted in earlier eras of polling to commonly under ten percent, and often considerably lower, in most developed countries today.
Caller ID, spam-call filtering, general distrust of unsolicited calls, and simple time pressure have all contributed to this decline, forcing pollsters to contact vastly more people to achieve the same completed sample size, substantially raising the cost of traditional telephone polling.
This collapse in response rates has been the single largest driver of the industry's shift toward online panels and mixed-method approaches over the past fifteen years, since traditional phone methodology became prohibitively expensive to sustain at scale.
How Pollsters Weight Their Raw Data
Because no real-world sample perfectly mirrors the population's actual demographic composition, pollsters apply statistical weighting after collection, adjusting the influence of each response so that the weighted sample matches known population benchmarks for characteristics such as age, gender, education, and region.
Weighting is a well-established and necessary statistical correction rather than a sign of manipulation, but it does introduce judgment calls, since pollsters must decide which characteristics to weight on and what population benchmarks to weight toward, choices that can meaningfully affect the final reported result.
Heavier weighting generally increases a poll's margin of error beyond the simple sample-size calculation, since a small number of respondents who happen to represent an underrepresented group end up carrying disproportionate statistical weight in the final result.
Why Different Polls on the Same Race Disagree
Two reputable polls conducted at roughly the same time on the same race can genuinely show different numbers without either being methodologically wrong, since differences in sample composition, likely-voter modelling, question wording, and weighting choices all introduce legitimate variation between otherwise sound surveys.
Statisticians generally advise treating any single poll cautiously and instead looking at the trend across multiple polls over time, or at an aggregate average, since individual poll-to-poll disagreement within a normal statistical range is expected rather than evidence of a fundamental problem.
Persistent, large, systematic disagreement between polling outlets, by contrast, is a genuine signal worth investigating, and is usually traceable to a clear methodological difference such as one pollster's specific likely-voter model or sampling frame.
How Likely-Voter Models Actually Work
Election polls face an additional challenge beyond simply measuring opinion: estimating who among those surveyed will actually vote, since a poll of all adults can differ meaningfully from a poll restricted to people genuinely likely to turn out on election day.
Pollsters build likely-voter models using a combination of self-reported voting intention, past voting history where available, and demographic turnout patterns, then apply that model to filter or weight the raw sample toward those judged most likely to actually cast a ballot.
Likely-voter modelling is widely considered one of the most difficult and consequential judgment calls in election polling, since a flawed model can introduce systematic error that persists across an entire polling cycle even when the underlying sampling itself was sound.
Why Online Panels Changed Polling Methodology
The shift from telephone to online panels, drawing on pools of people who have opted in to occasionally complete surveys, initially raised concerns about representativeness, since panel members are by definition people willing to join a survey panel rather than a random cross-section of the public.
Modern online-panel methodology addresses this partly through careful panel recruitment and heavy statistical weighting, and partly through probability-based online panels recruited via traditional random sampling methods and then given internet access if needed, an approach that preserves more of the statistical rigor of traditional sampling.
Online polling has now become the dominant method for most routine political and commercial polling in many countries, valued for its speed and considerably lower cost per completed response compared with live telephone interviewing, even as debate continues over its relative accuracy for specific hard-to-reach populations.
How Pollsters Try to Detect and Correct Bias
Reputable polling organisations validate their methodology by comparing results against verifiable outcomes, most commonly actual election results, and by conducting internal reviews when a poll diverges substantially from the eventual outcome, publishing methodology reports intended to identify what went wrong.
Industry bodies in several countries maintain public standards and disclosure requirements, including mandatory publication of sample size, field dates, and exact question wording, specifically so that independent statisticians and journalists can scrutinise a poll's methodology rather than taking its headline number on trust.
Despite these safeguards, genuinely unexpected sources of bias can still emerge, particularly when a specific subgroup of the population becomes systematically harder to reach or less willing to respond honestly than pollsters' models assume, a pattern that has affected several notable elections.
Why Some Elections Defied Poll Predictions
Several high-profile elections in recent decades produced results that diverged meaningfully from pre-election polling averages, prompting extensive post-mortem analysis from polling organisations and academic statisticians attempting to identify the specific methodological cause.
Common explanations identified across these post-mortems include underestimating turnout among groups less likely to respond to surveys, a phenomenon sometimes called differential non-response, along with flawed likely-voter models and, in some cases, a genuine late shift in opinion after polling had concluded.
These high-profile misses, while statistically less common than confident media coverage sometimes implies, have driven meaningful methodological reform across the polling industry, including more sophisticated weighting schemes and greater transparency about the uncertainty inherent in any single poll.
How Push Polls Differ From Legitimate Research
A push poll is not really a poll in the genuine research sense at all, but a political messaging tactic disguised as one, using leading or deliberately misleading questions to plant an impression in the respondent's mind rather than to measure their actual existing opinion.
Legitimate pollsters and industry associations consistently condemn push polling as a corruption of survey methodology, and reputable organisations can typically be distinguished from push-poll operations by their transparent disclosure of sample size, methodology, and funding source.
A useful practical test is scale and question design: a genuine poll interviews a modest, carefully selected sample with neutral questions, while a push poll typically contacts a far larger number of people with loaded or one-sided framing designed to spread a message rather than measure opinion.
Why Aggregating Multiple Polls Improves Accuracy
Because any single poll carries both random sampling error and its own specific methodological choices, statisticians generally recommend combining multiple polls into an aggregate average, which tends to cancel out some of the idiosyncratic variation between individual surveys and produce a more stable estimate.
Polling aggregators typically weight individual polls by sample size, recency, and a pollster's historical accuracy record, producing a combined estimate that has generally proven more reliable over time than relying on any single poll, however well conducted that individual poll might be.
Aggregation nonetheless cannot fully correct for a systematic industry-wide bias affecting most pollsters simultaneously, such as a shared blind spot in reaching a particular demographic, which is precisely the scenario behind several of the more notable historical polling misses.
How Exit Polls Actually Work
Exit polls interview voters immediately after they leave a polling station on election day itself, a fundamentally different method from pre-election polling since it asks people about a vote they have just genuinely cast rather than one they merely intend to cast in the future.
This timing eliminates likely-voter modelling uncertainty entirely, since every respondent has, by definition, actually voted, but exit polls introduce their own distinct challenges, including systematic refusal patterns where certain voter groups are more or less willing to stop and answer questions.
Exit polls are also used to help broadcasters project probable results before official counts are complete, a practice that has occasionally proven embarrassingly wrong when refusal patterns skewed the responding sample away from the true voting population in a particular contest.
What Polls Can and Cannot Tell Us
Public opinion polling, done well, remains one of the more reliable tools available for understanding what a large population genuinely thinks, resting on statistical foundations that are far more rigorous than the casual scepticism directed at any single surprising result might suggest.
What a poll cannot do is eliminate uncertainty entirely, capture opinion that is still genuinely shifting after fieldwork concludes, or fully correct for a systematic blind spot in reaching some segment of the population that behaves differently from the rest.
Reading polling responsibly means treating any single number as an estimate with a genuine margin of error and methodological assumptions attached, favouring trends and aggregates over individual data points, and paying attention to a pollster's disclosed methodology rather than the headline figure alone.
The underlying machinery, careful sampling, transparent weighting, and honest acknowledgement of uncertainty, is precisely what separates rigorous polling from a simple straw poll, and understanding it is the difference between reading a poll number as a fact and reading it as what it actually is: a carefully constructed statistical estimate.
None of this means polling is unreliable when done properly; it means polling is probabilistic rather than deterministic, and treating any single number as a certainty rather than a range with a confidence level is where most public misreadings of polls actually originate.
Sources
- Wikipedia — overview of polling methodology and history
- Pew Research Center — methodology standards and transparency practices in survey research
- American Association for Public Opinion Research — industry standards, disclosure requirements, and best practices
- Gallup — long-running public opinion methodology and historical polling data
- OECD — comparative statistical methodology guidance
FAQ
How can a poll of 1,000 people represent an entire country?
If the sample is drawn so that every person has a known, roughly equal chance of being selected, the mathematics of random sampling means a well-chosen sample of that size can estimate the whole population within a predictable margin of error.
What does a margin of error actually mean?
It describes the range within which the true population figure most likely falls given the sample size, typically expressed at a 95 percent confidence level, not a guarantee that the reported number is exactly correct.
Why do different polls on the same race show different numbers?
Pollsters use different sampling methods, likely-voter models, question wording, and weighting choices, so modest differences between reputable polls are normal statistical variation rather than evidence one is simply wrong.
Why have response rates to polls fallen so much?
Caller ID, spam filtering, and general distrust of unsolicited calls mean a small fraction of people contacted now actually complete a phone survey, forcing pollsters toward online panels and heavier statistical weighting.
Can a poll ever be completely wrong?
Yes — if the sample systematically excludes or under-represents a group that behaves differently from the rest of the population, no amount of statistical weighting can fully correct for that structural bias.
About the Author
We reference Wikipedia, the Pew Research Center, the American Association for Public Opinion Research, Gallup, and the OECD to explain the background and current understanding of this topic.
Loved This Article?
Share it on WhatsApp → Share it on WhatsApp
Get more guides in your inbox — Subscribe to our newsletter for weekly surprising stories from Egypt, Saudi Arabia, Dubai, and beyond.